






The Four Signals That Predict a Megaproject's Success

The early signs of cost overrun in energy megaprojects are often visible six to 18 months before they show up as schedule delays. These signals can include late interconnection studies, lengthening transformer lead times, or narrowing procurement windows. By the time they appear in the official schedule, the cost impact is already much harder to contain. Project teams miss them because most capital project tools track what has already happened, rather than detecting what is beginning to go wrong.
By the time a delay is visible in a schedule, the cost to correct it is already 5 to 15 times higher [1] than it was when the first signal appeared. This piece maps the four failure modes that drive that pattern – and what it looks like when project teams read them in time.
THE 4 FAILURE MODES IN CAPITAL PROJECT DELIVERY
Interconnection Queue Delay
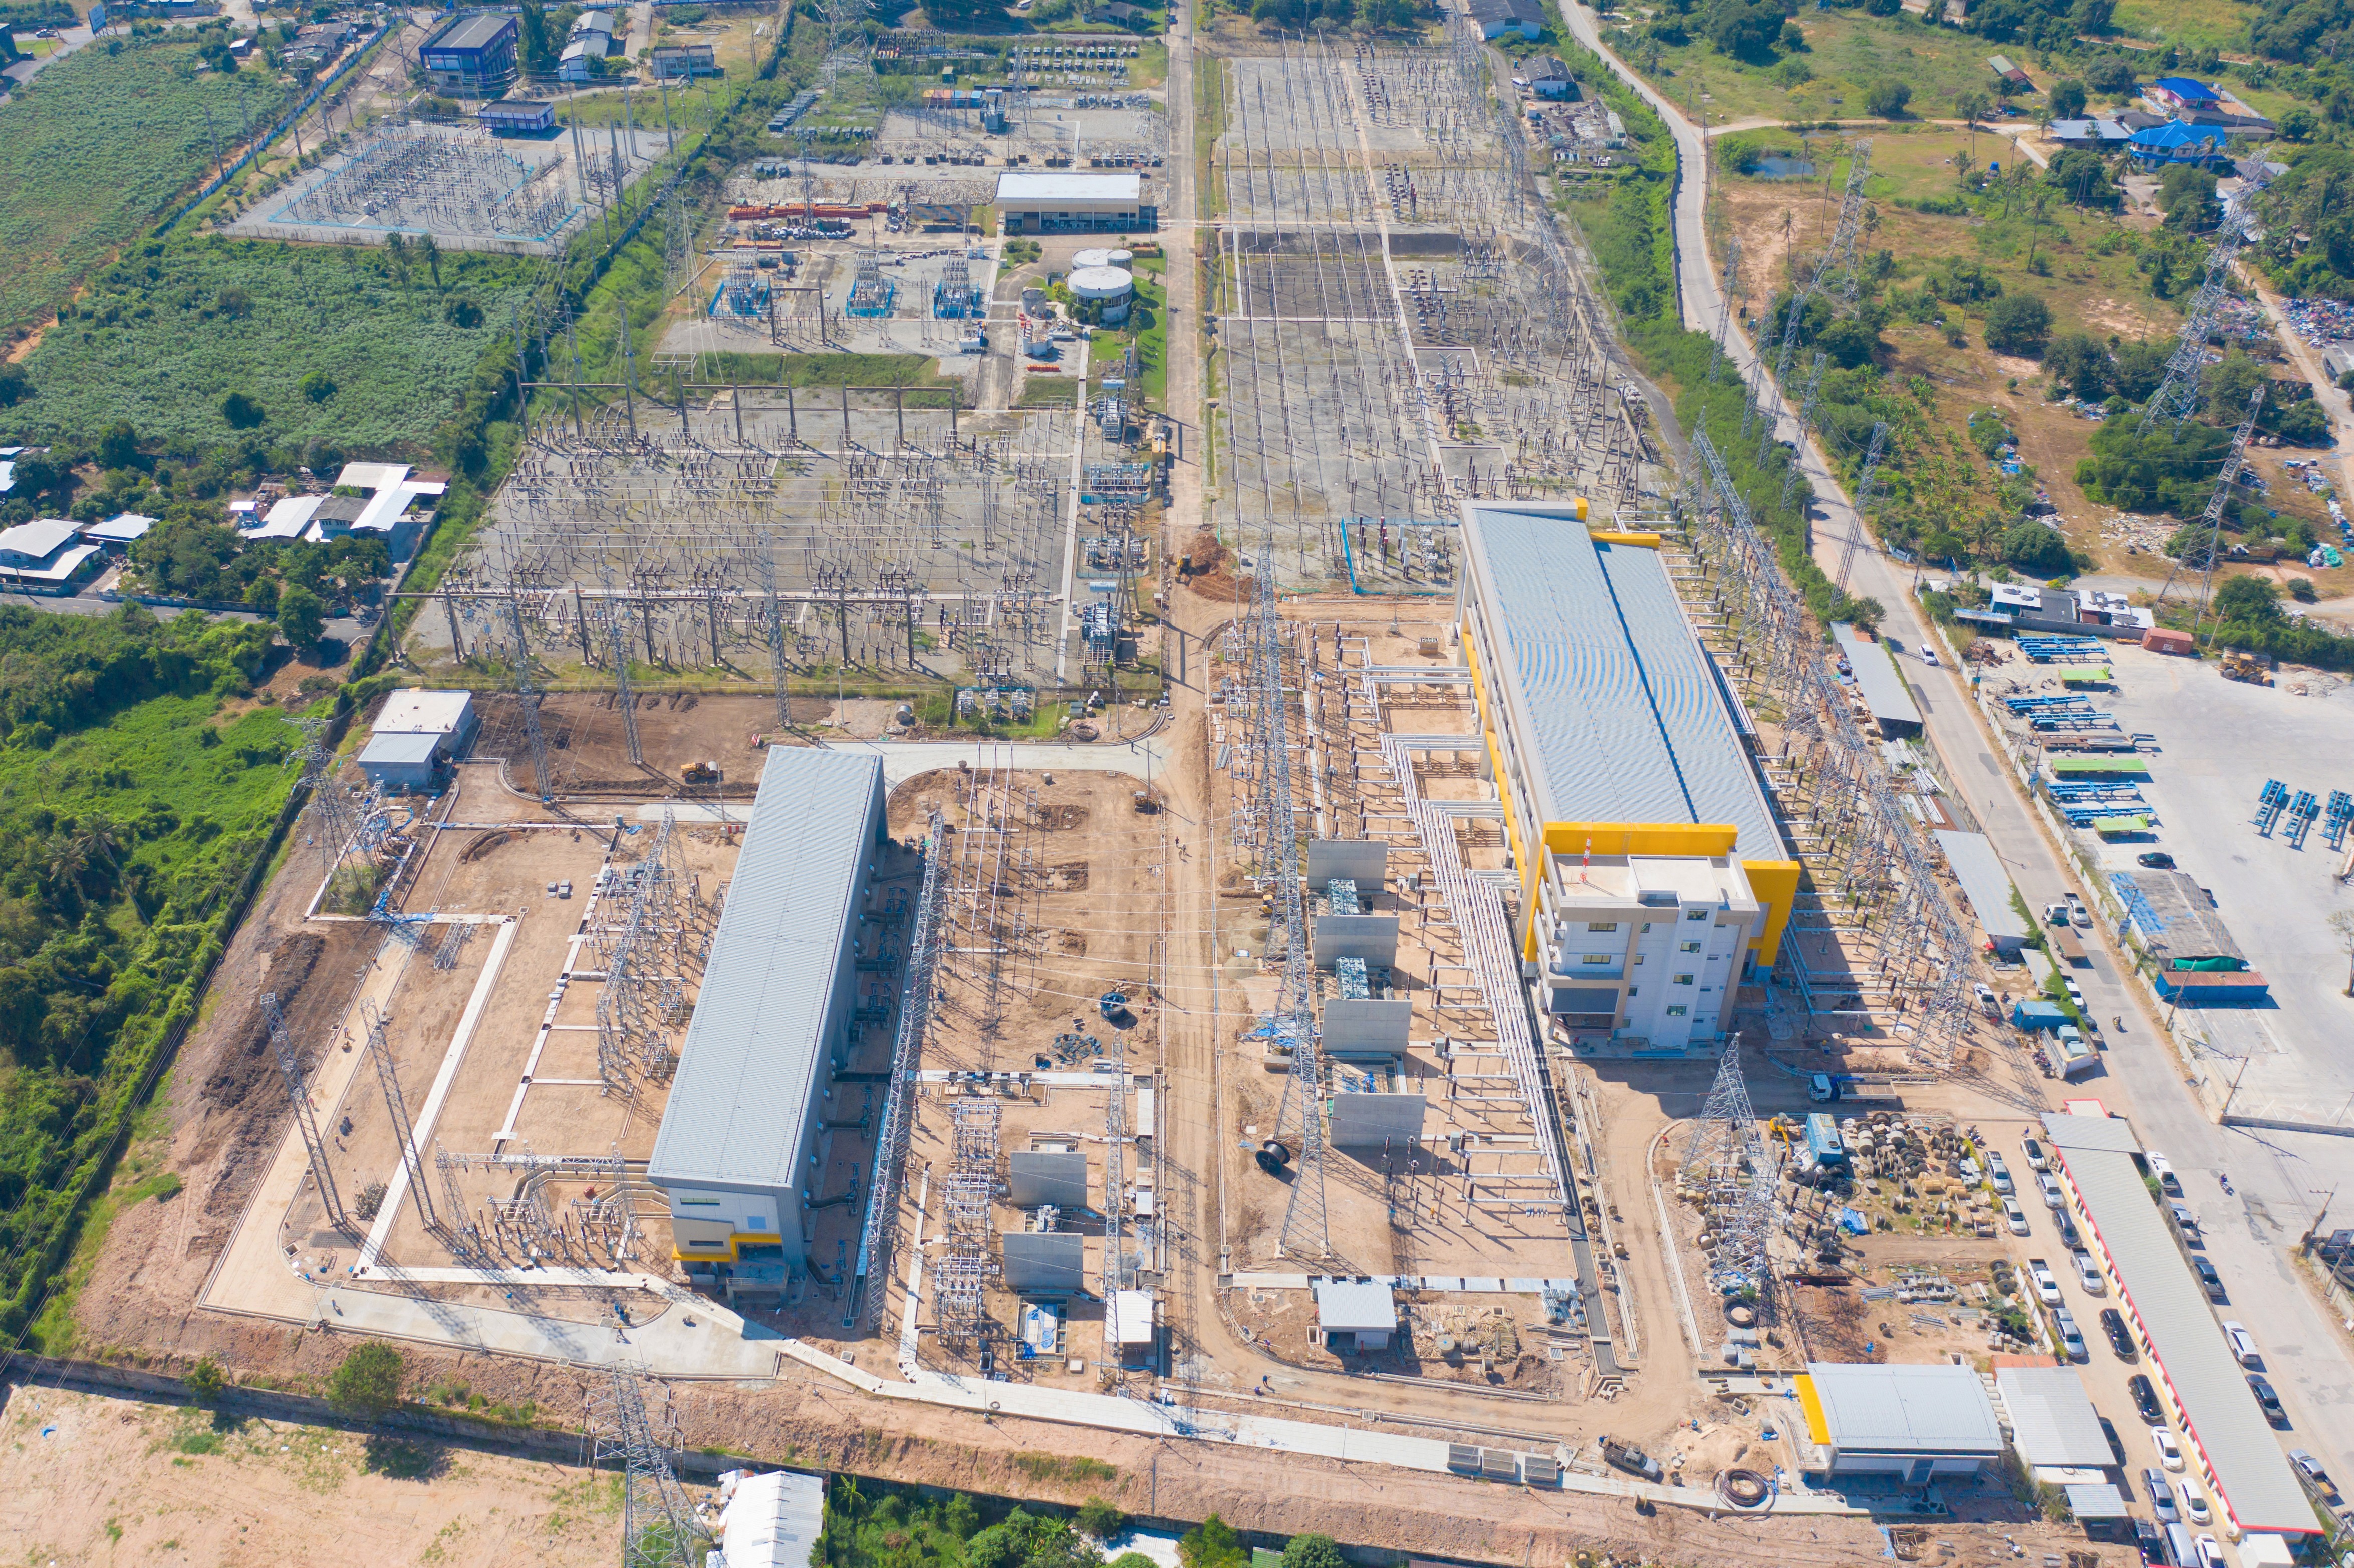
Since 2000, only 13 percent of projects that entered the U.S. interconnection queue (pipeline of proposed power projects requiring an electric grid) have reached commercial operation. 77 percent have withdrawn before completing the process. [2] Withdrawal doesn't always mean a project is dead: many developers resubmit under a new application, owing to factors such as network upgrade costs, revised designs, or a shift to a less congested node. But each resubmission resets the clock. A project with capital, equipment, and contractors lined up can still lose years to grid studies, approvals, and connection capacity. [2]
The backlog is massive. More than 2,000 GW of power generation and storage projects are currently waiting to connect to the grid; this is more capacity than the entire existing U.S. power system. [2] Most of the projects in that queue are competing for the same scarce grid capacity and the same finite pool of contractors, transformers, and financing windows. In some of the most crowded regions, including Northern Virginia, Phoenix, and Dallas, projects can wait four to seven years for approval. [3]For a project team, the queue is logged as a scheduling dependency and assigned a buffer. But what it actually represents is a capital exposure: every month a project sits in the queue, its schedule assumptions are degrading. Debt covenants, performance bonds, and financial close conditions are all anchored to a connection date that is structurally uncertain.
This risk often goes unmanaged due to a lack of continuous tracking. The updates that matter (study results, cost allocations, synchronization timelines) move through a periodic process built on spreadsheets, portals, and manual check-ins. A queue position can shift weeks before that shift shows up in a project's own schedule. AI monitoring can close this gap.AI interconnection queue management uses AI to monitor a project’s grid-connection status and flag when delays or queue changes could threaten the project’s timeline, budget, or financing. Put simply: it helps teams see grid-connection risk early, before it becomes a costly project delay.
Permitting Sequence Risk
The data on permitting delays is unambiguous. A 2024 DOE report found that grid transmission projects take an average of 10 years to complete – and 80 percent of that time is spent waiting for approvals, not building. One transmission project in the Pacific Northwest went live in 2024 a full six years after the utility needed it in service, with state and local permitting alone consuming eight to nine years of the schedule. A third of solar projects and half of wind projects that underwent full environmental impact review exceeded the statutory two-year NEPA deadline. [7] The deadline extends the process, sometimes for over a decade. Approval isn't the finish line either. Nearly half of solar and wind projects took four more years to reach operation after clearing review, in some cases longer than the review itself. [7]
What makes permitting risk particularly hard to manage is that it rarely fails at a single point. Regulatory sequencing (where a delay in one agency triggers a hold at the next) creates compounding effects that are invisible in most project schedules until the compounding has already occurred. A project team tracking individual permit status will miss the sequence. The signal is in the dependencies between permits, not in any one approval in isolation. No one person tracks a federal EIS timeline, a state permit docket, and a local zoning calendar as one connected system. AI can read across all three and surface the dependency.Procurement Lead Time Extension

Large power transformers that once took 12 to 18 months to procure now often take 18 to 26 months or more. Lead times have continued to stretch as demand grows faster than manufacturing capacity, and the backlog is now showing up in project schedules. [4] Wood Mackenzie's Q2 2025 survey found standard power transformers averaging 128 weeks for delivery, with generator step-up transformers at 144 weeks. [5] Steel fabrication backlogs follow a similar pattern. Neither figure is hidden. Both are routinely underpriced in project schedules because the baseline used at diligence reflects market conditions from two to three years prior. That number doesn't update itself once the project moves into execution. AI can check it against current market data on a standing basis, instead of leaving it fixed at whatever it was when the deal was signed.
A six-month increase in procurement lead time may not sound like a crisis on its own. But if the project schedule has no room for delay, that extra six months can cause direct cost overruns. For example, a project may schedule construction crews to begin work when a transformer is expected to arrive in 18 months. If the transformer is delayed to 24 months after those contracts are signed, the project may have to pay contractors to reschedule, extend equipment rentals, and carry financing costs for an additional six months before the asset can generate revenue. The delay itself creates the overrun because the rest of the project was planned around the original delivery date. If lead times continue to increase while project schedules remain unchanged, delays and cost overruns become more likely.Executive Sponsor Disengagement
The softest signal is the most predictive. When an executive sponsor at a project owner or developer begins to reduce their engagement cadence, it is almost always because their attention has moved to a different priority. Projects without active sponsor attention lose the internal political capital needed to reach commercial operation.
This signal does not appear in a project management system. It is visible in meeting records, decision logs, and communication patterns. This is exactly the data types that AI risk detection capital projects tools are increasingly built to read.
Kemper County illustrates the failure mode. An engineer at the Mississippi coal plant raised internal concerns that the project's timeline didn't match what was happening on site. After submitting documentation to company officials, he was told to stop communicating those concerns by email, according to a 2016 New York Times investigation. [8] Southern Company disputed the allegations. The plant, budgeted at $2.4 billion, ran more than $4 billion over.
AI RISK DETECTION FOR CAPITAL PROJECTS
The conventional approach to project risk management is rear-view: variances are identified when they appear in schedule or cost reports, escalated, and then managed. At that point, the cost to correct is already elevated. A procurement delay that surfaces in a monthly report has typically been developing for eight to twelve weeks. A permitting sequence problem that appears in a schedule review has usually been compounding for longer.
Addressing a risk signal at the point it first appears costs, on average, 1x the intervention cost. Addressing the same risk at execution after it has become a schedule event costs five to 15 times as much.[1]
Finding a risk signal six months before it becomes a delay is not the same as finding it in a monthly report. While the former gives you options, the latter presents a damage assessment. Seeing problems early changes what you can actually do about them, and that's the real payoff of AI-powered project intelligence over the old reactive tools. Imagine a project team that can spot shifts in interconnection studies, procurement delays, or permitting holdups six months before they turn into real problems. Options like repricing contingency, adjusting procurement strategy, or escalating sponsor engagement are only on the table before the delay gets logged.

One illustrative pattern: a utility-scale solar project in a constrained market enters the interconnection queue with a 28-month projected wait. At the 14-month mark, the queue position shifts when a cluster of large data centre projects files ahead of it, and the wait time extends to 42 months. The project team does not detect the shift for six weeks, because the queue monitoring process runs quarterly. By the time the extension is reflected in the project schedule, contractor commitments have been made and a financing close is pending.
THE DATA WAS ALWAYS THERE
The interconnection queue now holds 2,060 GW. [2] In the most constrained markets, projects wait four to seven years just to get an answer.[3] 77 percent of them get withdrawn. [2] Most of that backlog will never get built, and even the projects that do survive lose years to resubmission and re-study. [2] Transformers alone can take more than two years to arrive.[4] None of this is secret. These numbers are published, tracked, and cited across the industry every day. The real problem is the absence of a system built to catch this data early, when acting on it is still nearly free.
That system is the opportunity. The signals in this queue (status shifts, permitting sequences, procurement lead times, sponsor engagement) all live in data that already exists and already gets published or logged somewhere. AI-powered project intelligence is built to read that data continuously and flag what a person checking in periodically would miss.
The International Energy Agency (IEA) puts the global grid modernization investment requirement at more than $600 billion per year through 2030 [6]. AI for EPC project delivery is how the industry closes the gap between that number and current project performance. Closing that gap is more dependent on how early the information already available gets read, than new information. For project teams, capital allocators, and EPC firms, the once persistent problem is now solvable. The question it raises for every project team, capital allocator, and EPC firm in energy infrastructure is a straightforward one: at what point in your current pipeline does risk information enter your decision process, and is that early enough?
FURTHER READING
REFERENCES
[1] Flyvbjerg, B., Holm, M.K.S., and Buhl, S.L. “What Causes Cost Overrun in Transport Infrastructure Projects?” Transport Reviews, Vol. 24, No. 1 / Arxiv preprint, 2003. https://arxiv.org/pdf/1304.4476
[2] Rand, J. et al. (Lawrence Berkeley National Laboratory). “Queued Up: 2025 Edition – Characteristics of Power Plants Seeking Transmission Interconnection As of the End of 2024.” LBNL Energy Markets & Planning, 2025. https://emp.lbl.gov/publications/queued-2025-edition-characteristics
[3] Seel, J. (Lawrence Berkeley National Laboratory). “Queued Up: Status and Drivers of Generator Interconnection Backlogs.” Solar and Storage Finance USA presentation, LBNL, 2025. https://solar-media.s3.amazonaws.com/assets/LSSUSA25/Marketing/Presentations/Interconnection%20Queues%20and%20Costs,%2CSeel%204.29.2025%20public%20version.pdf
[4] CWIEME Berlin / PTR Intelligence. “24+ Month Lead Times: New Normal for Transformer Suppliers.” CWIEME Berlin Industry Analysis, 2026. https://berlin.cwiemeevents.com/articles/new-normal-component-suppliers
[5] Wood Mackenzie T&D Equipment Supply Chain Survey (cited in DistroForge). “Transformer Procurement 2026: Lead Times, Pricing & Strategy.” DistroForge / Wood Mackenzie Q2 2025, 2026. https://distroforge.com/blog/transformer-procurement-2026/
[6] International Energy Agency. “Electricity Grids and Secure Energy Transitions – Executive Summary.” IEA, 2023. https://www.iea.org/reports/electricity-grids-and-secure-energy-transitions/executive-summary
[7] Fraas, A.G. et al. Resources for the Future. "How Long Does It Take? National Environmental Policy Act Timelines and Outcomes for Clean Energy Projects." RFF Reports, 2025. https://www.rff.org/publications/reports/how-long-does-it-take-national-environmental-policy-act-timelines-and-outcomes-for-clean-energy-projects/
[8] Urbina, I. The New York Times. "Piecing Together the Story of a Mississippi Power Plant Set to Cost Billions." NYT, 2016. https://www.nytimes.com/2016/07/05/science/kemper-coal-mississippi.html